---
title: "Optimizing the sh*t out of TanStack Start"
url: "https://sarthakmishra.com/library/blog/optimizing-tanstack-start"
description: "A practical TanStack Start performance guide: how cutting downloads and fixing fonts and images took my home page from 73 to 100 on mobile Lighthouse."
image: "https://sarthakmishra.com/og-images/blog/optimizing-tanstack-start.webp"
---
[View HTML](https://sarthakmishra.com/library/blog/optimizing-tanstack-start) · [Site index](https://sarthakmishra.com/llms.txt)
# Optimizing the sh\*t out of TanStack Start
A practical TanStack Start performance guide: how cutting downloads and fixing fonts and images took my home page from 73 to 100 on mobile Lighthouse.

A few days after I [moved this site to TanStack Start](https://sarthakmishra.com/library/blog/astro-to-tanstack-start), the home page scored 73 on mobile PageSpeed Insights. Its largest contentful element was a paragraph, with a reported paint time of **5.2 seconds**.
That’s a long wait for a paragraph.
I worked through the site with [Claude Code and Codex](https://sarthakmishra.com/library/blog/optimizing-tanstack-start#how-i-used-claude-code-and-codex), tracing what the browser downloaded and what kept it from painting. A card component was sending the whole image catalog to every page. Closed dialogs loaded their code anyway. Phones downloaded images for navigation they couldn’t see.
Most of the useful fixes came from removing work I’d accidentally given the browser.
By October 30, the home page scored **100, with LCP down to 0.9 seconds**. I also built a critical CSS pipeline and delayed hydration. Those took much more work, and I still can’t tell you how much they contributed to the score.
| Mobile home-page metric | [October 24, before the fixes](https://pagespeed.web.dev/analysis/https-sarthakmishra-com/adninyd8c2?form_factor=mobile) | [October 30, after this optimization round](https://pagespeed.web.dev/analysis/https-sarthakmishra-com/x5yjk1zd4x?form_factor=mobile) |
| ------------------------ | ------------------------------------------------------------------------------------------------------------------------ | ------------------------------------------------------------------------------------------------------------------------------------- |
| Performance | 73 | 100 |
| First Contentful Paint | 2.3 s | 0.9 s |
| Largest Contentful Paint | 5.2 s | 0.9 s |
| Total Blocking Time | 160 ms | 0 ms |
| Cumulative Layout Shift | 0.002 | 0.002 |
| Speed Index | 4.5 s | 0.9 s |
These are individual lab runs on the live home page, with several changes between them. They show where I started and ended, not what each fix contributed. The later run was captured on October 30 at 10:43 PM IST.
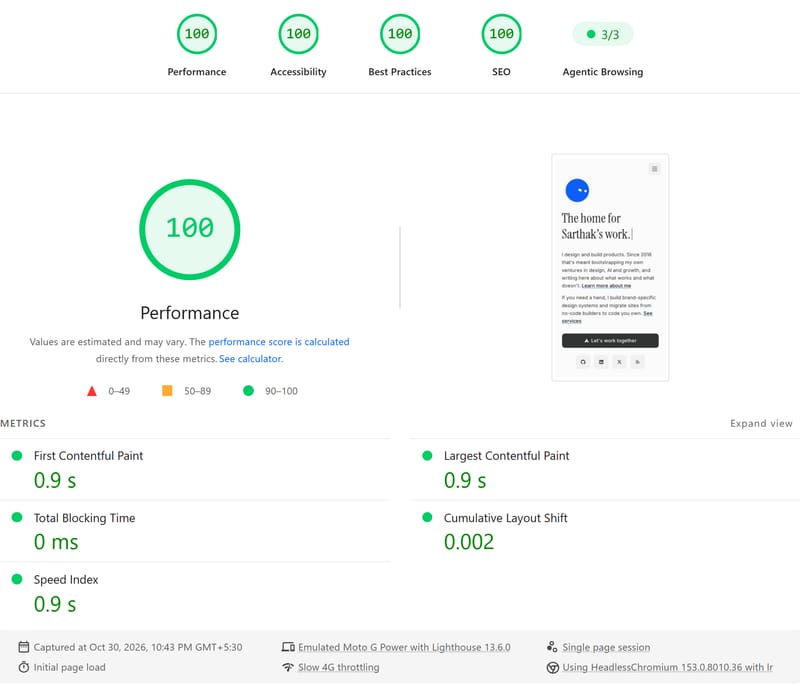
The live home page on mobile, October 30, 2026.
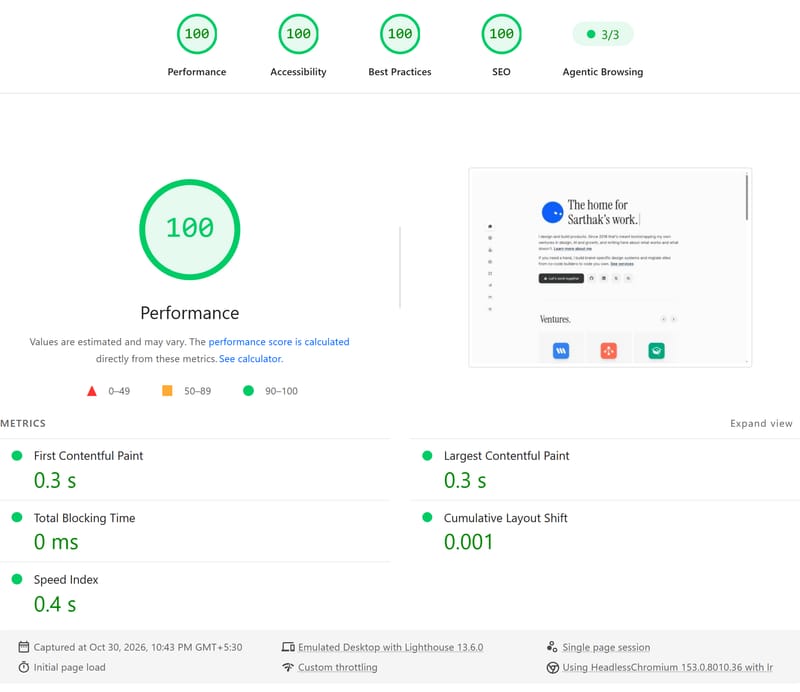
The desktop report captured on October 30, 2026.
**Updated November 11, 2026.** I later [removed Tailwind from this site](https://sarthakmishra.com/library/blog/tailwind-to-native-css). The new Post covers the component-owned CSS system, the MDX and navigation stylesheet loader, and the bundle measurements across all 76 pages. The screenshots above preserve the October PageSpeed Insights results described in this Post.
If you’re working on a similar app, I’d start with [unnecessary JavaScript](https://sarthakmishra.com/library/blog/optimizing-tanstack-start#stop-loading-the-rest-of-the-site), [fonts](https://sarthakmishra.com/library/blog/optimizing-tanstack-start#smaller-fonts-made-the-text-jump), and [hidden images](https://sarthakmishra.com/library/blog/optimizing-tanstack-start#phones-were-downloading-the-desktop-navigation). The [CSS and hydration experiments](https://sarthakmishra.com/library/blog/optimizing-tanstack-start#critical-css-gave-me-less-blocking-css-and-more-upkeep) are further down, along with what broke.
## Find out what the paragraph is waiting for
The document arrived in about 110 ms and already contained the paragraph. There was no client-side data fetch to wait for. That narrowed the investigation to what happened in the browser.
**Find your LCP element before optimizing anything.** Mine was text already in the document, so I started with fonts, blocking CSS, and downloads competing with them.
The [Performance score](https://developer.chrome.com/docs/lighthouse/performance/performance-scoring) comes from measured timings. This is where I’d start for each slow metric.
| What you see | Where I’d look first |
| ----------------------------------------------------- | ----------------------------------------------------------------------------- |
| The document itself arrives late | Server response time, route loaders, sequential data requests, caching |
| First Contentful Paint (FCP) is late | Render-blocking CSS, font loading, work before the first frame |
| Largest Contentful Paint (LCP) is much later than FCP | The LCP element, when its resource is discovered, and what delays its display |
| Total Blocking Time (TBT) is high | Long JavaScript tasks, hydration, third-party scripts, animation loops |
| Cumulative Layout Shift (CLS) is high | Font swaps, missing media dimensions, content inserted above existing content |
| Speed Index is high | Filmstrip frames, late visible sections, animation during the initial load |
Where to look once you know the LCP element · No · Yes · Image · Text · LCP element · In the HTML response? · Route loaders, prerendering, server reads · Image or text? · Discovery, priority, sizes · Fonts and render-blocking CSS · JavaScript and hidden downloads competing for bandwidth
Check the document response first. If the content is there but appears late, the cause is in the browser.
### Check the response before React changes it
Open the document request in DevTools and search its Response tab for your heading and main text. The DOM after hydration doesn’t tell you what the server sent.
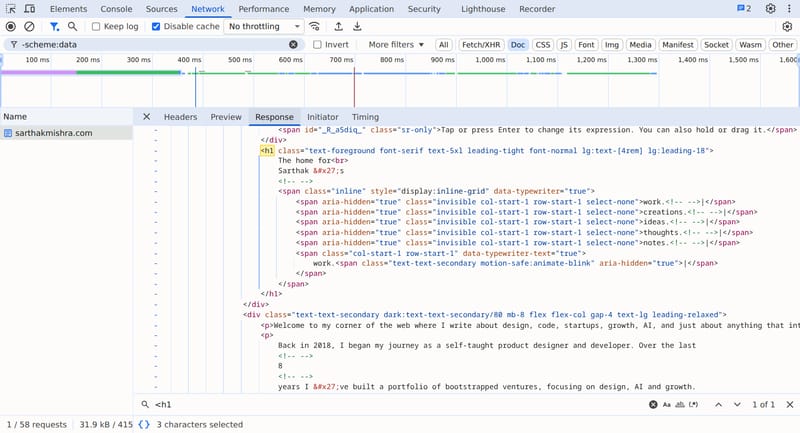
Select the document request, open Response, and search for your heading or main text. This is the HTML the server sent, before client rendering changes the DOM.
If the content is missing, fetch it in a route loader. Start’s [execution model](https://tanstack.com/start/latest/docs/framework/react/guide/execution-model) allows loaders to run on the server and in the browser, so server-only code still needs a server boundary. Moving an import into a loader doesn’t keep it out of the client bundle.
For public pages that can be generated at build time, [static prerendering](https://tanstack.com/start/latest/docs/framework/react/guide/static-prerendering) puts the content in the document. This configuration prerenders two routes.
```typescript
tanstackStart({
prerender: {
enabled: true,
autoStaticPathsDiscovery: false,
crawlLinks: false,
},
pages: [
{ path: '/', prerender: { enabled: true } },
{ path: '/about', prerender: { enabled: true } },
],
});
```
Personalized pages still need request-time rendering. Check the deployed [Content-Encoding](https://developer.mozilla.org/en-US/docs/Web/HTTP/Reference/Headers/Content-Encoding) and [Cache-Control](https://developer.mozilla.org/en-US/docs/Web/HTTP/Reference/Headers/Cache-Control) headers too. Content-hashed assets can have a long cache lifetime. HTML needs one that fits how often it changes.
### Make sure the measurements are comparable
Use a production build. Development mode includes work visitors never receive. Repeat the audit with the same settings, compare medians, and confirm on the deployed site.
On October 25, the same build scored 91, 95, and 92 within a few minutes. PageSpeed also reused cached audits under new report links, so I had to check capture times before counting a run as new.
My local preview caused a different distraction. It served 165 KiB of uncompressed HTML and scored 94 to 95. Brotli took the same document to about 28 KiB and the score to 99, much closer to production. I could have spent a while trying to fix the app for that one.
Once the HTML and the test setup were accounted for, the Network panel showed what else the page was asking for.
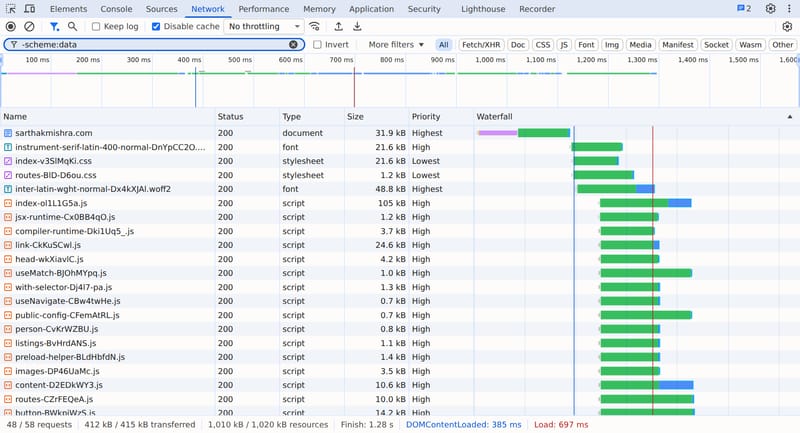
Right-click a Network column heading to enable Priority and Waterfall. Read across each row to see what downloads, its priority, and when it starts. The filter hides data URLs.
## Stop loading the rest of the site
A card component imported the full image manifest. That made every page download metadata for 117 images, about **35 KiB compressed**, even when it displayed a handful. The images had their own downloads. These were their descriptions and rendition URLs, shipped as JavaScript.
Each route now carries the image data it renders. Navigation fetches newly needed data. I also removed tooling-only excerpts and unused recommendation scores from the shared content index.
The home page’s module-preloaded JavaScript fell from roughly 234 to 196 KiB. Its HTML grew from about 42 to 49 KiB because it now contained the selected image data. I was happy with that trade. The unrelated catalog stopped going to every reader.
**Check both the loader response and the emitted bundles.** Returning a smaller object won’t help much if an import still puts the full dataset in the browser’s startup code.
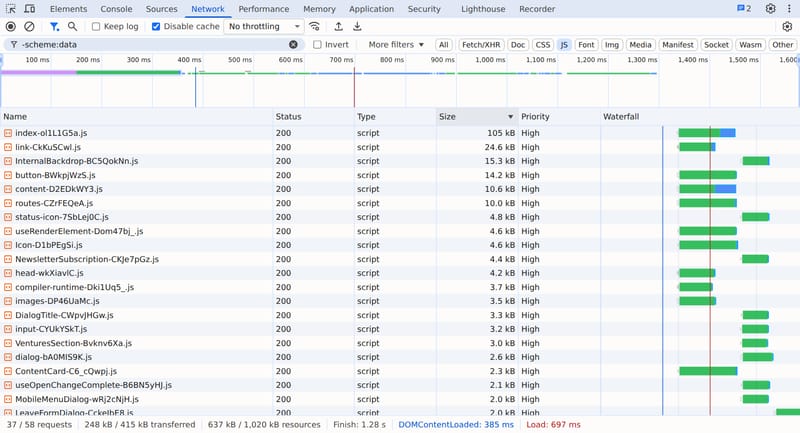
Choose JS and sort Size from largest to smallest to find downloads worth investigating. Transfer size tells you what to inspect; a Performance recording shows what costs CPU time.
Filter Network to JS, sort by size, and trace the larger files back to their imports. Compare a simple route with a complex one. Shared downloads often lead back to the root route, a layout, or a component both pages use.
### A closed dialog can still download
TanStack Router’s [route code splitting](https://tanstack.com/router/latest/docs/framework/react/guide/code-splitting) separates routes. Within a route, search, the mobile menu, image enlargement, a portrait viewer, and a leave-form confirmation were all adding to my initial load.
A lazy component is a start. Declare it at module scope.
```tsx
import { lazy } from 'react';
const SearchDialog = lazy(() => import('./SearchDialog'));
```
`SearchDialog` is a default export here. [React requests the module when you first try to render it](https://react.dev/reference/react/lazy). Rendering it with `open={false}` can therefore start the download while the dialog is closed.
I kept the triggers available and mounted the dialogs on first open. They need `Suspense`, an error boundary, and enough time to finish closing and return focus before unmounting. Initially, I warmed their chunks after page load so the first interaction wouldn’t wait for a download.
That cut the initial JavaScript.
| Page | Before, KiB gzip | After, KiB gzip |
| ----------- | ---------------- | --------------- |
| Home | 196.1 | 174.4 |
| A long post | 213.0 | 190.8 |
But the warm-up still charged every reader for features most wouldn’t use. Base UI’s dialog engine alone added about 14 KiB gzip after load on every page. I later changed the triggers to load on hover, focus, or press. The first tap on a phone can wait briefly for the chunk. I accepted that.
Verify the requests in the browser. A separate chunk hasn’t saved a download if the page immediately preloads it.
[Filtering a recorded Chrome DevTools Network log to fonts and JavaScript, then sorting JavaScript requests by size.](https://sarthakmishra.com/videos/optimizing-tanstack-start/network-filters/native.m3u8)
In a recorded Network log, choose Font, then JS. Click Size until the largest downloads appear first. This short clip has no audio.
## Smaller fonts made the text jump
The normal Inter file was about 342 KiB. Fontsource’s WOFF2 subsets let the browser request only the character ranges a page uses. Removing the optical-size axis then took the normal Latin file from 71.2 to 47.1 KiB, about a third smaller. I kept small symbol supplements for characters the interface still needed.
I also cut three font preloads to one, the normal Latin Instrument Serif face used by the heading. Other faces load when text needs them.
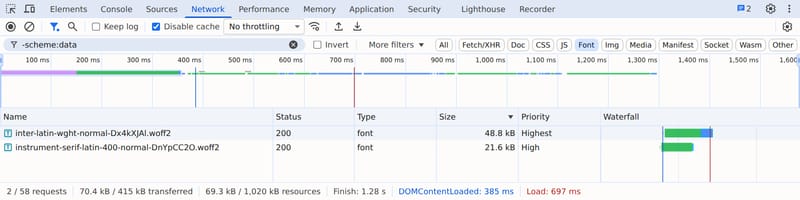
The Font filter isolates the files this page downloaded. Compare their sizes and start times before changing font imports or preload hints.
Check the family, weight, style, and character range of each request. A preload should earn its place by fixing measured late discovery in the initial view. Its URL, `type`, and `crossorigin` mode must match the font request, or you can download it twice. [Google’s font-loading guide](https://web.dev/articles/optimize-webfont-loading) explains the details.
The smaller downloads exposed another problem. Text appeared sooner, then moved when the web font arrived. Newsletter Issue 1 recorded CLS around 0.21 during those changes because the heading changed size and pushed everything below it.
**A faster font swap still needs a stable fallback.** I adjusted the fallback’s metrics to bring its dimensions closer to Instrument Serif.
```css
@font-face {
font-family: 'Instrument Serif Fallback';
src:
local('Times New Roman'), local('TimesNewRomanPSMT'),
local('Liberation Serif'), local('Noto Serif');
size-adjust: 83.75%;
ascent-override: 118.2%;
descent-override: 37.01%;
line-gap-override: 0%;
}
```
Put the fallback after the web font in the `font-family` stack. These percentages belong to my pairing, so measure yours. Google’s [CLS guidance](https://web.dev/articles/optimize-cls) covers the overrides. A cold-load recording with the filmstrip visible will show whether the text appears early and stays put.
A later desktop regression came from the font chosen before these fallbacks. The deferred `Noto Color Emoji` name matched an installed system font, which rendered ordinary spaces and digits until Inter arrived. Giving that webfont a private family name (`Portfolio Color Emoji`) fixed the shifts.
## Phones were downloading the desktop navigation
My desktop navigation was hidden on phones. Its eager images still appeared in the preload list. Nine requests for navigation the reader couldn’t see.
Marking the images lazy removed the preloads. The sidebar now waits for hydration and a desktop-sized viewport before decoding its images, so phones never request them. Desktop navigation appears slightly later as a result.
Video posters had the same problem. I’d deferred the enhanced player with an `IntersectionObserver` but left the poster eager. The player could wait for scrolling while its poster downloaded immediately. Both needed deferral.
### Give the visible image the priority it needs
On a page with an image LCP, make that image discoverable in the initial HTML, eager, and eligible for high fetch priority. [Google’s LCP guidance](https://web.dev/articles/optimize-lcp) separates time to first byte, resource discovery, transfer, and render delay. The Performance panel shows where the time went.
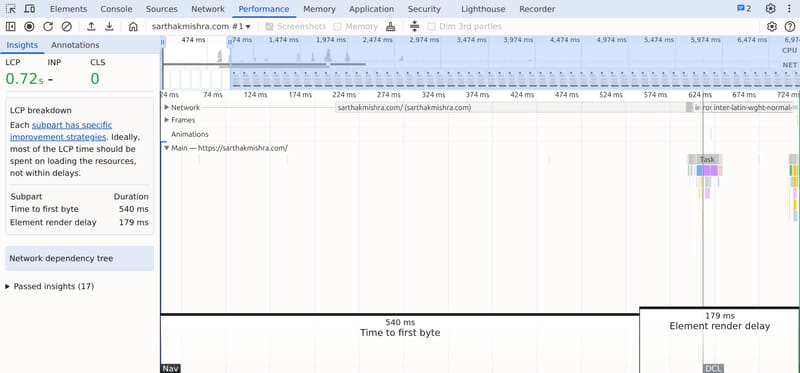
Open LCP breakdown in a Performance recording. This page has a text LCP, so the breakdown shows time to first byte and element render delay. An image LCP can also include resource loading phases.
For an image in a container capped at 960 pixels, with 16-pixel gutters on smaller screens, the markup looks like this.
```tsx
```
Those paths assume generated 16:9 renditions. The `sizes` hint describes the layout. On my site, which uses different renditions, correcting it let a phone choose a 640-pixel file where it had previously chosen a 1080-pixel one.
Images further down can load lazily. Reserve their space with dimensions so they don’t move the page when they arrive.
## Give deferred work a reason to start
I had an idle home-page animation updating SVG geometry about 30 times a second. Delaying its start still left that work running. It needed to stop when it had nothing to do.
Choose a trigger for each piece of work, then check what it does after that trigger.
| Work | A useful starting policy |
| ------------------------------------------ | ------------------------------------------------------------ |
| Main text, initial styles, LCP resource | Available for the first render |
| A video player or heavy embed further down | Prepare as it approaches the viewport |
| Search, an editor, or a dialog | Load on intent or first use |
| Decorative animation | Start after load, then pause when idle or out of view |
| Third-party scripts | Load when the feature needs them, accounting for measurement |
For decorative work, this helper waits for `load` and an idle slot. It also works if `load` has already fired.
```typescript
export function afterPageLoad(callback: () => void) {
let idle = 0;
let timer = 0;
const schedule = () => {
if (typeof requestIdleCallback === 'function') {
idle = requestIdleCallback(callback, { timeout: 2000 });
} else {
timer = window.setTimeout(callback, 200);
}
};
if (document.readyState === 'complete') schedule();
else window.addEventListener('load', schedule, { once: true });
return () => {
window.removeEventListener('load', schedule);
if (idle) cancelIdleCallback(idle);
window.clearTimeout(timer);
};
}
```
Call it from client-side setup and cancel the pending callback during cleanup. Any loop or subscription it starts needs its own cleanup too.
Deferral changes behavior. My analytics loads on first interaction or a few seconds after load, so it can miss a very short visit. Form verification starts on focus, giving it time to load before submission. Test with someone who starts using the page as soon as it appears.
### React Compiler cost bytes I chose to keep
I’d already adopted the [native React Compiler](https://oxc.rs/blog/2026-08-18-react-compiler-support.html#vite). Across five alternating baseline and compiled pairs on three routes, timings stayed roughly unchanged while compressed JavaScript grew by 9.5 to 14.1 KiB per route.
I kept it because it replaced hand-written memoization. That maintenance benefit was worth the measured byte cost to me. It couldn’t decide whether a closed dialog belonged in the first load, though. Loading changes needed their own measurements.
## Critical CSS gave me less blocking CSS and more upkeep
After the unnecessary downloads, I worked on how the stylesheet arrived. This was where the fixes became harder to justify.
I first moved feature styles out of the global stylesheet and into their owning routes or components. Start tracks side-effect CSS imports and CSS modules in its route manifest. Explicit `?url` links returned from `head().links` sit outside that manifest, which matters for its built-in delivery features. The [CSS styling guide](https://tanstack.com/start/latest/docs/framework/react/guide/css-styling) covers both.
I tried all three delivery strategies.
| Strategy | Benefit | Cost to measure |
| ------------------------------------------------ | ------------------------------- | ----------------------------------------------- |
| External route CSS | Reusable browser cache | A blocking request on a cold visit |
| Inline route CSS | Removes that stylesheet request | More HTML on every document load |
| Extracted critical CSS plus deferred stylesheets | Fewer rules needed before paint | Extraction complexity and more states to verify |
Start’s experimental, production-only option inlines route CSS from its manifest.
```typescript
tanstackStart({
server: {
build: { inlineCss: true },
},
});
```
Inlining repeated the full route stylesheet in every document. Moving feature styles out and switching back to external files roughly halved the home page’s HTML. PageSpeed couldn’t separate the results convincingly. The inlined version scored 91 to 95 across three runs. The first two external-CSS runs scored [92](https://pagespeed.web.dev/analysis/https-sarthakmishra-com/ilmnkrz1n9?form_factor=mobile) and 97.
Then I used [Beasties](https://github.com/danielroe/beasties) to extract rules matching each prerendered document. Those rules went inline. The complete stylesheets loaded through the `media="print"` and `onload` [pattern](https://web.dev/articles/defer-non-critical-css), with a `
 ```
Those paths assume generated 16:9 renditions. The `sizes` hint describes the layout. On my site, which uses different renditions, correcting it let a phone choose a 640-pixel file where it had previously chosen a 1080-pixel one.
Images further down can load lazily. Reserve their space with dimensions so they don’t move the page when they arrive.
## Give deferred work a reason to start
I had an idle home-page animation updating SVG geometry about 30 times a second. Delaying its start still left that work running. It needed to stop when it had nothing to do.
Choose a trigger for each piece of work, then check what it does after that trigger.
| Work | A useful starting policy |
| ------------------------------------------ | ------------------------------------------------------------ |
| Main text, initial styles, LCP resource | Available for the first render |
| A video player or heavy embed further down | Prepare as it approaches the viewport |
| Search, an editor, or a dialog | Load on intent or first use |
| Decorative animation | Start after load, then pause when idle or out of view |
| Third-party scripts | Load when the feature needs them, accounting for measurement |
For decorative work, this helper waits for `load` and an idle slot. It also works if `load` has already fired.
```typescript
export function afterPageLoad(callback: () => void) {
let idle = 0;
let timer = 0;
const schedule = () => {
if (typeof requestIdleCallback === 'function') {
idle = requestIdleCallback(callback, { timeout: 2000 });
} else {
timer = window.setTimeout(callback, 200);
}
};
if (document.readyState === 'complete') schedule();
else window.addEventListener('load', schedule, { once: true });
return () => {
window.removeEventListener('load', schedule);
if (idle) cancelIdleCallback(idle);
window.clearTimeout(timer);
};
}
```
Call it from client-side setup and cancel the pending callback during cleanup. Any loop or subscription it starts needs its own cleanup too.
Deferral changes behavior. My analytics loads on first interaction or a few seconds after load, so it can miss a very short visit. Form verification starts on focus, giving it time to load before submission. Test with someone who starts using the page as soon as it appears.
### React Compiler cost bytes I chose to keep
I’d already adopted the [native React Compiler](https://oxc.rs/blog/2026-08-18-react-compiler-support.html#vite). Across five alternating baseline and compiled pairs on three routes, timings stayed roughly unchanged while compressed JavaScript grew by 9.5 to 14.1 KiB per route.
I kept it because it replaced hand-written memoization. That maintenance benefit was worth the measured byte cost to me. It couldn’t decide whether a closed dialog belonged in the first load, though. Loading changes needed their own measurements.
## Critical CSS gave me less blocking CSS and more upkeep
After the unnecessary downloads, I worked on how the stylesheet arrived. This was where the fixes became harder to justify.
I first moved feature styles out of the global stylesheet and into their owning routes or components. Start tracks side-effect CSS imports and CSS modules in its route manifest. Explicit `?url` links returned from `head().links` sit outside that manifest, which matters for its built-in delivery features. The [CSS styling guide](https://tanstack.com/start/latest/docs/framework/react/guide/css-styling) covers both.
I tried all three delivery strategies.
| Strategy | Benefit | Cost to measure |
| ------------------------------------------------ | ------------------------------- | ----------------------------------------------- |
| External route CSS | Reusable browser cache | A blocking request on a cold visit |
| Inline route CSS | Removes that stylesheet request | More HTML on every document load |
| Extracted critical CSS plus deferred stylesheets | Fewer rules needed before paint | Extraction complexity and more states to verify |
Start’s experimental, production-only option inlines route CSS from its manifest.
```typescript
tanstackStart({
server: {
build: { inlineCss: true },
},
});
```
Inlining repeated the full route stylesheet in every document. Moving feature styles out and switching back to external files roughly halved the home page’s HTML. PageSpeed couldn’t separate the results convincingly. The inlined version scored 91 to 95 across three runs. The first two external-CSS runs scored [92](https://pagespeed.web.dev/analysis/https-sarthakmishra-com/ilmnkrz1n9?form_factor=mobile) and 97.
Then I used [Beasties](https://github.com/danielroe/beasties) to extract rules matching each prerendered document. Those rules went inline. The complete stylesheets loaded through the `media="print"` and `onload` [pattern](https://web.dev/articles/defer-non-critical-css), with a `